What you can see in this report depends on your user role.
Accessing Outbound Activity
- Go to the Admin Portal and sign in.
-
Click Reports to expand it, then select Call Summary > Outbound Activity.

Viewing Outbound Activity
 Select Last 10 Days or Last 30 Days to see a bar graph of outbound calls by status:
- Answered (OUT) (Blue): Calls answered.
- No Answer (OUT) (Green): Calls not answered.
- Busy (OUT) (Red): Calls that got a busy signal.
- Failed (OUT) (Purple): Calls that failed to connect.

Filters
-
In the filter settings, pick a start and end date, or pick a preset: Last week, Last month, Last 3 months, Last 6 months, or Last year.

-
Choose a distribution: Daily, Monthly, or Hourly.

-
Optionally, filter by:
- Branch
- Call Outcome: The outcome set on the call.
- User: The users who made the outbound calls.

-
Under Outbound Activity Dispositions, choose which outcomes to show: Answered, No Answer, Busy, or Failed.

-
Optionally, pick a secondary metric to show alongside the main data:
- Call Quality
- Inbound Calls: Then filter by Answered, No Answer, Busy, or Failed.
- Internal Calls
- Talk Time: Then filter by Inbound, Outbound, or Total.
- Total Calls: Then filter by Answered, No Answer, Busy, or Failed.

-
Click Update to apply your filters. To clear them, click Reset.

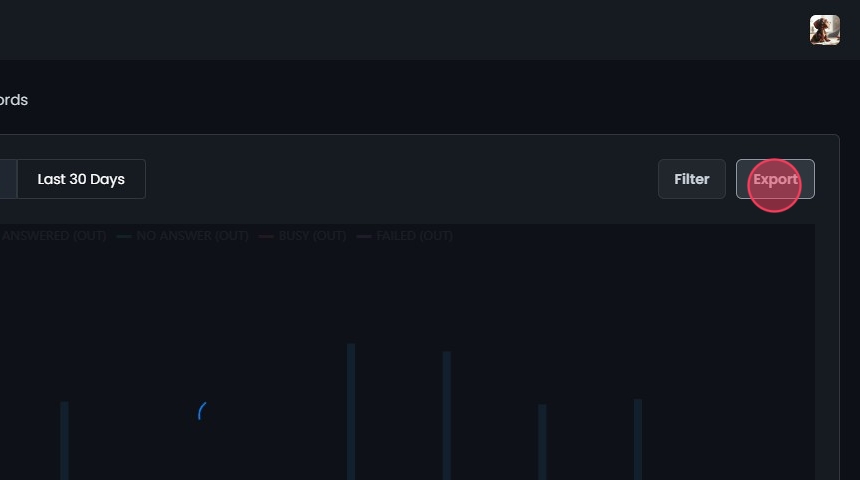
 To download the data shown as a CSV file, click Export.
Outbound Heatmap
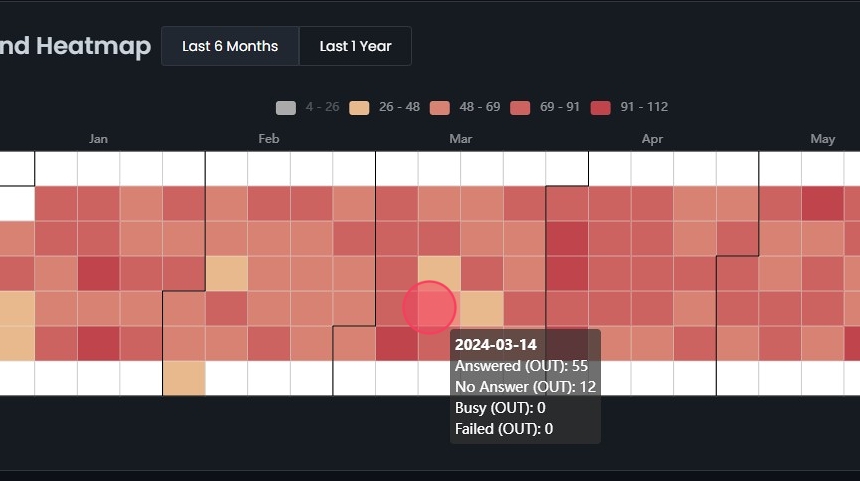
The Outbound Heatmap shows outbound call volume over time. Each square is a day, colored by the number of calls. Click Last 6 Months or Last 1 Year to set the date range.
 The colors mean:
- Yellow: 4 - 26 calls
- Light Orange: 26 - 48 calls
- Orange: 48 - 69 calls
- Dark Orange: 69 - 91 calls
- Red: 91 - 112 calls
 Click a color label at the top to hide those days. For example, clicking Yellow hides days with 4 - 26 calls.
 Hover over a square to see that day’s Answered (OUT) (blue), No Answer (OUT) (green), Busy (OUT) (red), and Failed (OUT) (purple) counts.