This guide provides detailed instructions on how to access and utilize the Outbound Activity report in Omnia. It includes information on how to view and analyze outbound call activities, apply filters, select date ranges, and export data. The guide also explains how to use the Outbound Heatmap features to visualize call volumes over specific periods.
Alert: Access to this Report:
- Access to this report is based on your user role. You may not be able to access and view a specific report and all of its features if your role does not permit it.
Accessing Outbound Activity
1. Access Outbound Activity:
- Go to the Admin Portal and sign in.
- Click the Reports tab to expand it.
- Select Call Summary, then Outbound Activity.

Viewing Outbound Activity
2. Overview:
- This section provides a detailed summary of outbound call activities, helping you analyze call patterns and performance over specific periods.

3. #### Last 10 Days:
- View a bar graph showing the status of outbound calls.
- Categories displayed:
- Answered (OUT): Calls answered. (Blue)
- No Answer (OUT): Calls not answered. (Green)
- Busy (OUT): Calls with a busy signal. (Red)
- Failed (OUT): Calls failed to connect. (Purple)
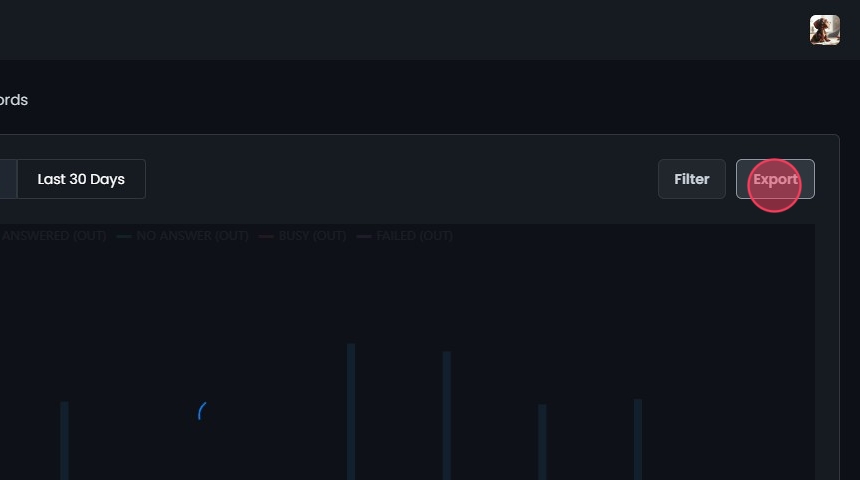
Last 30 Days:
- View a similar bar graph for the last 30 days.
- Categories and colors remain consistent as above.
Graph Details:
- The graph displays data based on your selection (last 10 days or last 30 days).
- Hover over the bars to see daily stats.
- Each bar represents a different category of call status (Answered, No Answer, Busy, Failed).

Filters
4. Filter Settings:
- Select Date Range: Choose the start and end dates for the report to customize the period for which you want to view the data.
- Predefined Date Filters: Quickly filter data by predefined date ranges such as Last week, Last month, Last 3 months, Last 6 months, and Last year.

5. Select Distribution:
- Choose to view data daily, monthly, or hourly.

6. Filter By:
- Branch: Filter data by specific a specific branch.
- Call Outcome: Filter by the outcome of calls.
- User: Filter data based on the users who made outbound calls.

7. Select Outbound Activity Dispositions:
- Choose between different call outcomes to display in the report:
- Answered
- No Answer
- Busy
- Failed

8. Select a Secondary Metric:
- Display additional metrics alongside primary data:
- Call Quality: Quality of the call connections.
- Inbound Calls: Number of inbound calls.
- Internal Calls: Number of internal calls.
- Talk Time: Total talk time for the calls.
- Total Calls: Total number of calls.
- Additional filters based on the selected secondary metric:
- Inbound Calls: Filter by Answered, No Answer, Busy, Failed.
- Talk Time: Filter by Inbound, Outbound, Total.
- Total Calls: Filter by Answered, No Answer, Busy, Failed.

9. #### Apply Filters:
- After setting your desired filters, click on the Update button to apply them. This will update the report to reflect the selected criteria.
- Click Reset to remove the filters.

10. Graph Details:
- Data Points: Hovering over the bars in the graph now provides detailed statistics based on the filters selected.

11. Exporting Data:
- Click Export to download the displayed data in CSV format.
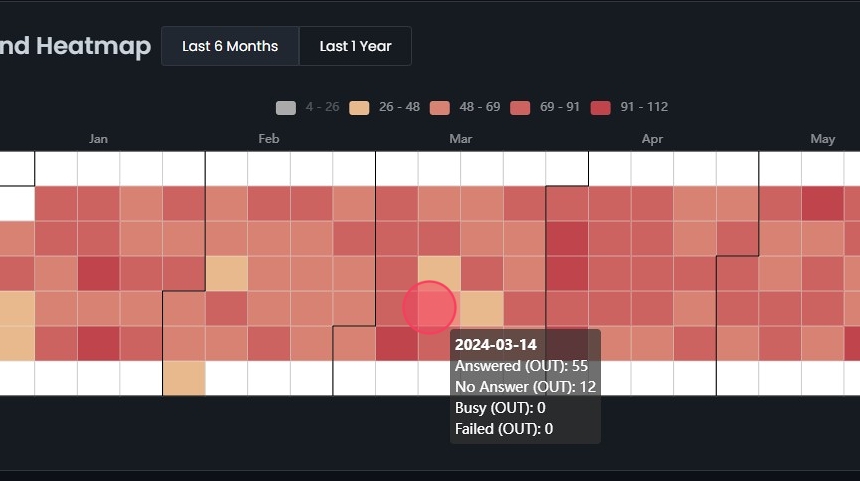
Outbound Heatmap
12. Outbound Heatmap Overview:
- The Outbound Heatmap visualizes the volume of outbound calls over a selected period. Each square represents a day, with colors indicating the number of calls.

13. Select Date Range:
- Select a date range to get started.
- Last 6 Months: Displays a heatmap representing the number of outbound calls over the past six months.
- Last 1 Year: Displays a similar heatmap for the past year.

14. View Heatmap:
- The heatmap will display the volume of outbound calls, with the following color coding:
- Yellow: 4 - 26 calls
- Light Orange: 26 - 48 calls
- Orange: 48 - 69 calls
- Dark Orange: 69 - 91 calls
- Red: 91 - 112 calls

15. Filter by Call Volume:
- Click on the color labels at the top to filter the heatmap. Clicking on a label will remove it from the view, allowing you to focus on specific call volume ranges. For example, clicking on the Yellow label will exclude days with 4 - 26 calls from the heatmap.

16. Analyze Data:
- Data Points: Hovering over the cells in the heatmap provides detailed statistics for each day, including:
- Answered (OUT) in blue
- No Answer (OUT) in green
- Busy (OUT) in red
- Failed (OUT) in purple