
This document provides a comprehensive guide for accessing and analyzing IVR activity reports within the Omnia Admin Portal. It covers navigating to the reports section, selecting specific IVRs, filtering data, understanding key metrics, and exporting data. The guide also explains how to interpret various metrics such as total entries, valid and wrong key presses, and other IVR events to help optimize the performance of virtual receptionists.
Alert: Access to this Report:
- Access to this report is based on your user role. You may not be able to access and view a specific report and all of its features if your role does not permit it.
Accessing IVR Activity
1. Navigate to the Reports Section:
- Go to the Admin Portal and sign in.
- Click the Reports tab to expand it.
- Select Virtual Receptionists, then IVR Activity.

Filtering the Data
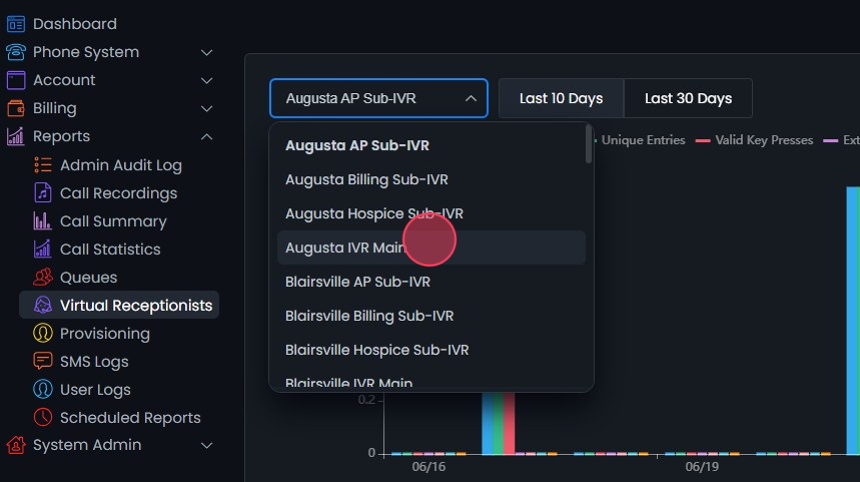
2. Choose an IVR:
- Click on the dropdown menu to select the desired IVR from the list.
3. Select a Date Range:
- You can quickly select the last 10 days or last 30 days using the buttons provided.

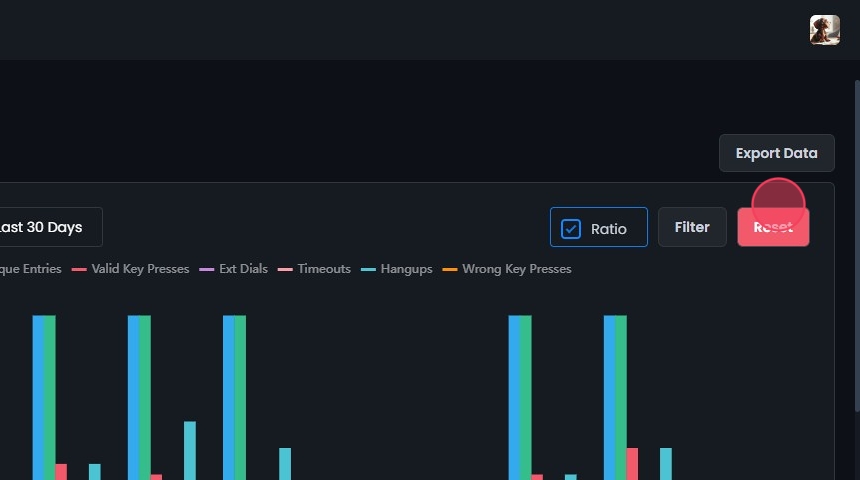
4. Select Count or Ratio:
- Toggle between Count and Ratio to view the data in the preferred format.

5. Filter Settings:
- Click the Filter button to open the settings and choose the desired date range and time. Additional options include: Last week, Last month, Last 3 months, Last 6 months, and Last year.
- Select the data distribution: Daily, Monthly, or Hourly.
- Click Update to apply the filters.

6. Reset Filters:
- Click the Reset button to remove all applied filters.
Understanding the Metrics
7. IVR Activity Metrics:
- Total Entries (Blue): The total number of entries into the IVR system.
- Unique Entries (Green): The number of unique entries.
- Valid Key Presses (Red): The number of valid key presses detected.
- Ext Dials (Purple): The number of extension dials.
- Timeouts (Pink): The number of times callers were timed out.
- Hangups (Teal): The number of hang-ups detected.
- Wrong Key Presses (Orange): The number of incorrect key presses.
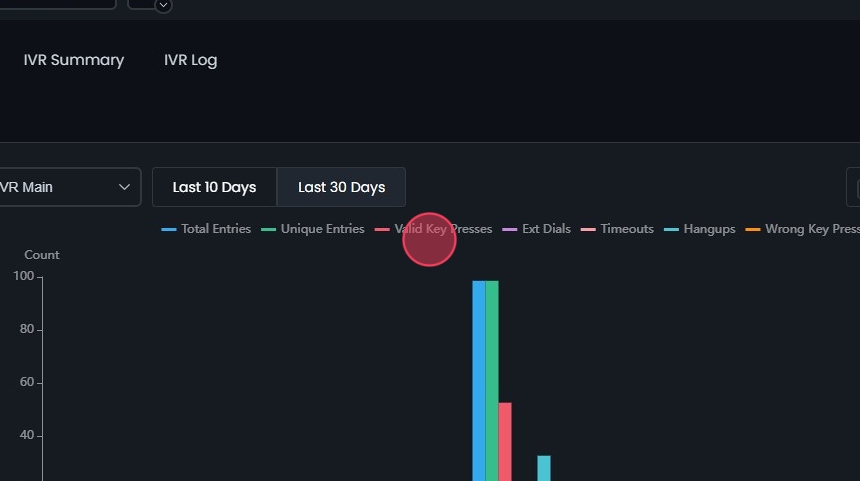
8. Interpreting the Data:
- The graph displays these metrics over the selected date range.
- Hover over the graph points to see detailed information for each metric.

9. Use the Legend to Filter Metrics:
- Click on any metric in the legend to remove it from the view.
- This feature allows you to focus on specific metrics by filtering out the others.

Exporting Data
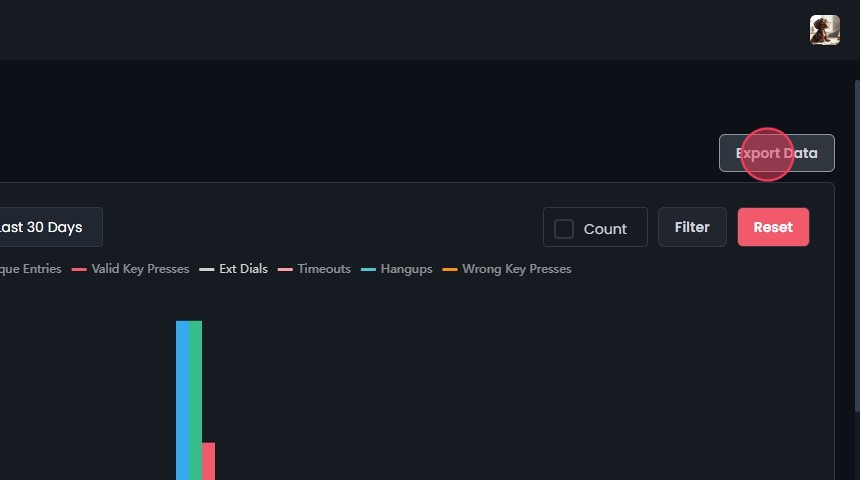
10. Export IVR Data:
- After applying the desired filters, click the Export Data button to download the report based on the selected criteria.
Viewing Additional Metrics
11. Loop Ratio:
- The loop ratio measures the number of loops per unique entry to the virtual receptionist.
- Shows the total number of entries and unique entries.
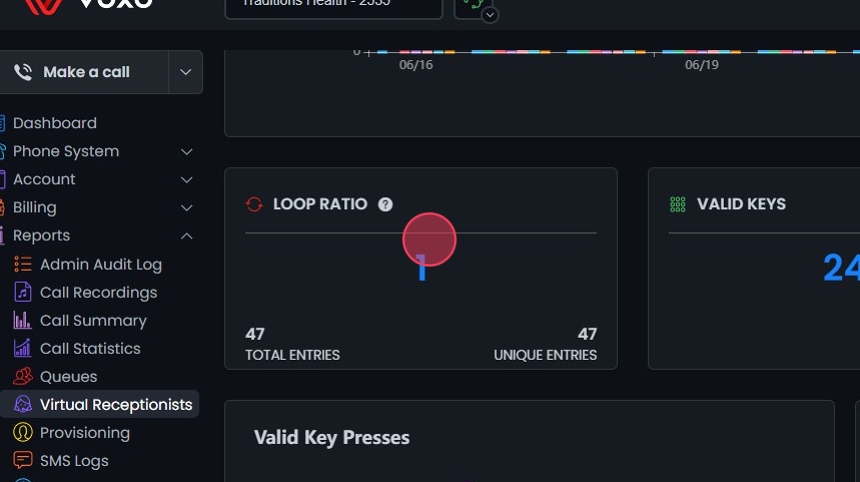
12. Valid Keys:
- Displays data on valid key presses in the IVR system.
- Click Total to view the total number of valid key presses.
- Click Avg to see the average number of valid key presses per day.
- Click % to view the percentage of valid key presses compared to all key presses.

13. Wrong Keys:
- Displays data on incorrect key presses in the IVR system.
- Click Total to view the total number of wrong key presses.
- Click Avg to see the average number of wrong key presses per day.
- Click % to view the percentage of wrong key presses compared to all key presses.

14. Valid Key Presses:
- Displays the number of valid key presses in the IVR system.
- Pie Chart:
- Each segment represents a different key press.
- Hover over a segment to see the exact count (e.g., key "2" was pressed 18 times).
- Legend:
- Color-coded for each key press.
- Click on a legend item to highlight or remove the corresponding segment from the pie chart.

15. Valid Key Presses:
- Shows the count of valid key presses in the IVR system.
- X-axis: Number of key presses.
- Y-axis: Specific keys pressed.
- Hover over a bar to see the exact count.
- Green color indicates valid key presses.

16. Wrong Key Presses:
- Displays the count of incorrect key presses in the IVR system.
- Axes:
- X-axis: Number of key presses.
- Y-axis: Specific keys pressed.
- Bars:
- Each bar shows a wrong key press.
- Bar length = Number of incorrect presses.
- Hover over a bar to see the exact count (e.g., key "1" was pressed 5 times).
- Legend:
- Red color indicates the count of wrong key presses.

17. Extension Dialing:
- Displays the frequency of extension dialing attempts.
Table Columns:
- Extension: Lists the dialed extensions. Click the column header to sort by extension number.
- Count: Number of times each extension was dialed. Click the column header to sort by count.
- %: Percentage of total extension dialing attempts. Click the column header to sort by percentage.

18. Other Events:
- Displays various events in the IVR system.
Graph Elements:
- X-axis: Shows different events (Ext Dials, Timeouts, Hangups).
- Y-axis: Represents the count of each event.
- Bars:
- Each bar represents the count of a specific event.
- Hover over a bar to see the exact count (e.g., Timeouts = 50).
Options:
- Total: Shows the total number of each event.
- Avg: Displays the average number of each event.
- %: Shows the percentage of each event.
